Offline-Online Gap in RecSys: 11 Release Gates and Incident Playbook
TL;DR: In deep learning RecSys, better offline numbers often mean the model fit historical logs better, not that it will improve real product outcomes after rollout. The root causes are structural: feedback loops, selection/exposure/position bias, delayed labels, train/serve skew, negative sampling bias, stage coupling, and objective mismatch. The practical answer is an engineering control loop: strict logging contract, counterfactual evaluation with explicit limits, point-in-time feature correctness, multi-stage release gates, shadow/canary/rollback, and an incident playbook.
How to read this article
- If you need a release decision quickly: go to sections 8, 9, 10, 11, 13.
- If you are debugging an
offline up / online downincident: go through sections 1, 2, 3, 4, 5, 6, 7, then section 11. - If your goal is a stable quarterly operating process: use sections 8, 9, 12, 13, 14, 15 as the baseline plan.
Why this article exists
This is a production-oriented reference for teams already shipping or actively rolling out DL-based recommendation systems and seeing this pattern:
- offline reports show improvement;
- product KPIs degrade or become unstable after release;
- degradation becomes visible only days or weeks later.
The goal is to map root mechanisms, define method limits, and provide an operating template that materially lowers release risk.
What exactly is the offline-online gap
In production terms, the gap is:
where:
Offline: metrics on historical logs or offline replay;Online: live KPIs, including quality, reliability, and economics guardrails.
Core point: once you deploy a new policy, exposure changes. That means the observed distribution is no longer the same one used in offline evaluation. This structural shift is consistent with 2025-2026 work on feedback loops: Systematic review, Simulation framework, Diversity paradox revisited, JIIS 2026.
Failure map: what usually breaks in production
| Cause | What breaks | What it looks like in metrics | First check |
|---|---|---|---|
| Feedback loops | Model changes future logs and amplifies its own bias | short-term goes up, long-term drops | cohort analysis before/after release + retraining rounds |
| Selection/exposure bias | Logs are not representative for the new policy | offline overestimates candidates from historical exposure | check if propensity, position, and exposure are logged |
| Delayed labels | Fresh window has many immature labels | early plus, late minus | immature outcome share on target KPIs |
| Train/serve skew | Features differ between training and serving | score distribution jump after release | parity check on serving snapshot |
| Negative sampling bias | Retrieval gets distorted by sampling policy | recall/coverage drop in live traffic | audit sampling policy and logQ corrections |
| Objective mismatch | Model optimizes the wrong business target | CTR up, retention/satisfaction down | check hard downstream guardrails |
| Stage coupling | Local gain breaks end-to-end funnel | retrieval improves, feed worsens | stage-level attribution and funnel diagnostics |
| Non-stationarity / drift | Context shifts quickly | gradual degradation without clear incident | drift + freshness + slice monitoring |
1) Feedback loops: why offline gains can be an illusion
A recommender system shapes user behavior. That behavior becomes new training data. Then the model retrains on its own footprint. This is a closed loop. Static offline splits do not fully model it, so some gains are illusory.
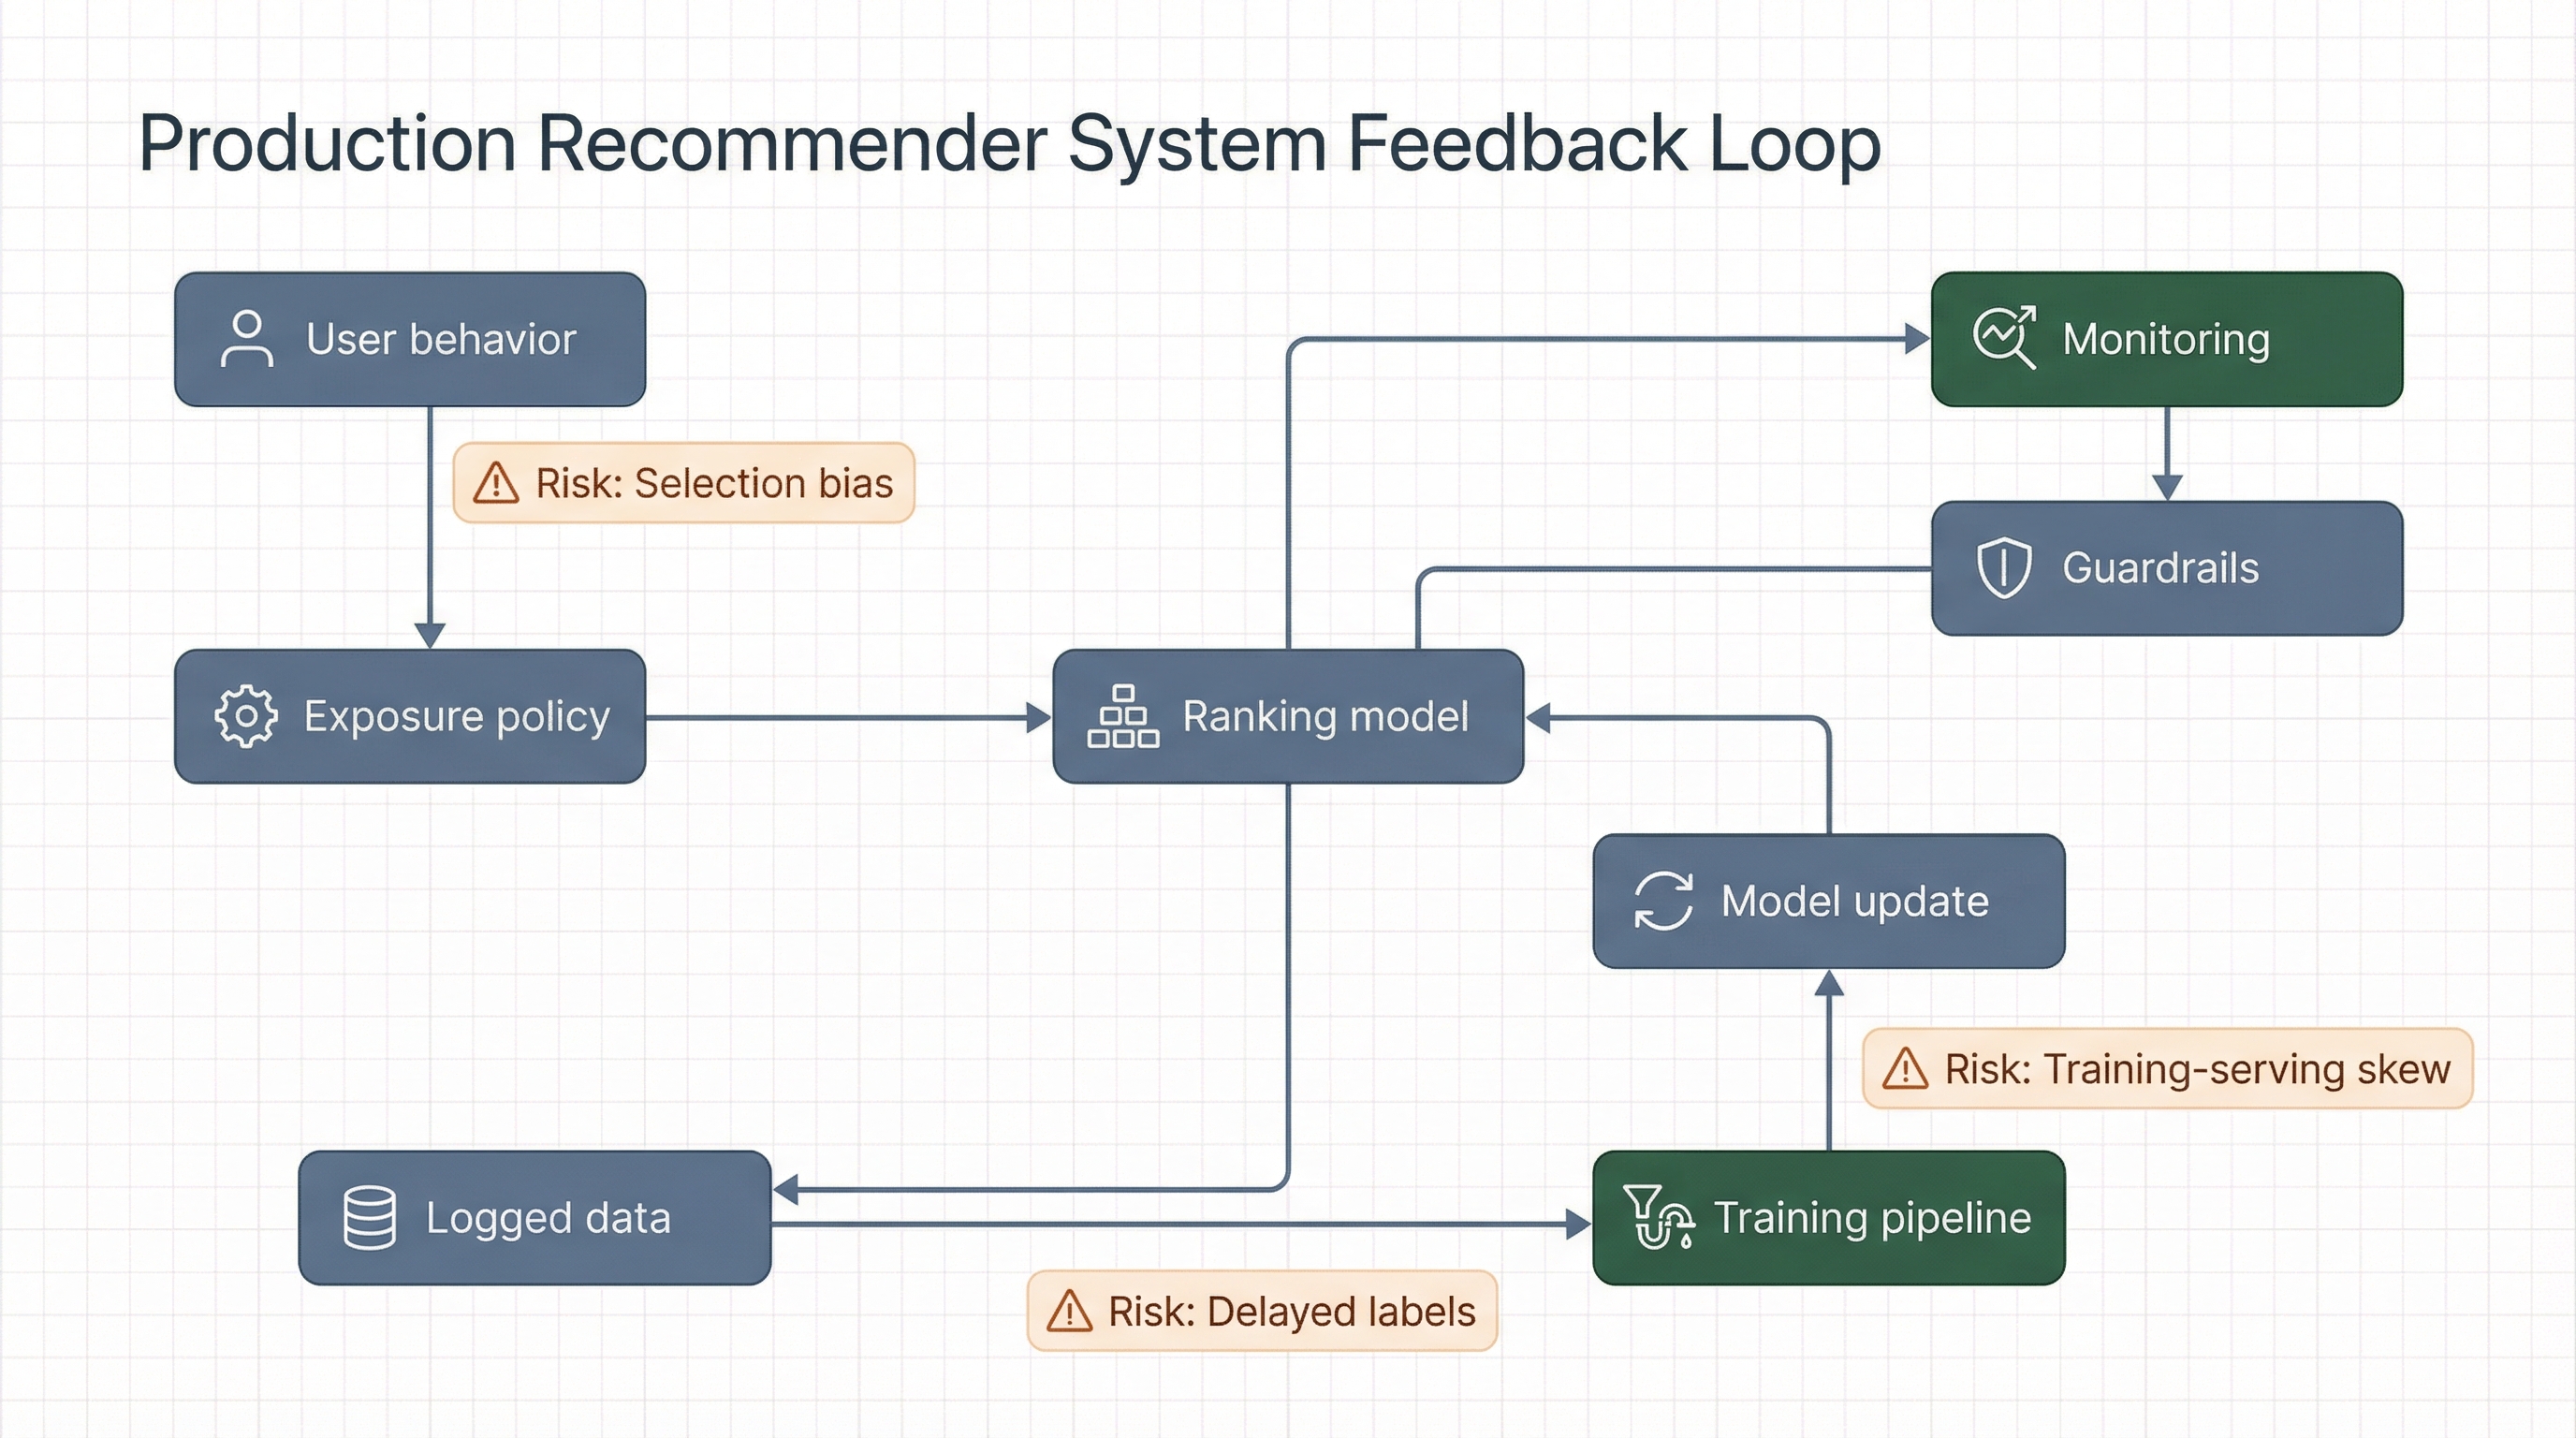
Feedback loop in practice: why offline gains on historical logs do not guarantee post-rollout improvement in live traffic.
What matters from recent work:
- 2025-2026 research repeatedly highlights lack of multi-round validation, while long-term loop behavior depends on it: SLR 2025;
- periodic retraining simulations show systemic effects on diversity and concentration: 2510.14857, 2602.16315;
- 2026 journal results reinforce risks around popularity bias and group disparity: JIIS 2026.
Production implication:
- Do not treat a single offline pass as sufficient evidence for 100% rollout.
- Require shadow/canary before full rollout, with cohort fairness and diversity controls.
- For critical surfaces, add multi-round replay/simulation evaluation.
2) Selection/exposure/position bias: why historical logs can mislead
Historical RecSys logs are generated by a previous policy and UI exposure layer. Users cannot interact with items they were never shown. This is a classic MNAR setting.
Foundational references:
- Recommendations as Treatments, ICML 2016;
- Unbiased learning-to-rank under biased feedback, IJCAI 2018.
Current signals in 2025:
- RecSys 2025 includes active tracks on exposure bias, debiasing, and OPE reliability: Accepted contributions 2025;
- offline-online alignment remains an explicit research topic: RecSys 2025 poster index.
IPS baseline:
where μ is logging policy and π is target policy.
Note: this is the single-action contextual bandit form of IPS. Ranking/slate evaluation needs position-aware or slate-aware propensity modeling.
OPE also assumes positivity/overlap and sufficiently accurate propensity estimates. Both assumptions are frequently violated in real RecSys logs.
Critical limit: under unobserved confounding, even careful OPE can remain biased. OPE should not be the only gate to production. See Jeunen & London, 2023.
3) Delayed labels: false negatives and evaluation shift
In production recommender systems, target signals are often delayed:
- conversion arrives after click;
- long watch or return behavior appears later;
- some outcomes mature with significant lag.
If training uses windows that are too fresh, positive outcomes are still hidden and many examples are mislabeled as negatives.
Recent references:
- Delayed Feedback Modeling with Influence Functions (2025);
- Neural Contextual Bandits Under Delayed Feedback Constraints (2025).
Practical control loop:
- Track two horizons: immediate and mature.
- Add label-maturity metrics to the release dashboard.
- Do not approve full rollout on immature windows.
- Use non-inferiority guardrails for delayed KPIs on mature data.
4) Train/serve skew: the most expensive silent failure
Skew appears when train and serve see different effective features: transformation differences, join timing, schema drift, preprocessing code divergence, or cache artifacts.
Primary references:
- Rules of ML (Google, updated 2025-08-25);
- Feast joins the PyTorch ecosystem (2026);
- Databricks point-in-time joins;
- Feast documentation.
Minimum operational baseline:
- one transformation path for train and serve;
- mandatory
feature_snapshot_idin serving logs; - point-in-time joins for training (no time leakage);
- parity test before canary.
For a shorter practical release contract template, see MLOps for Production ML: 7 Release Gates for Controlled Rollouts. This article extends it for offline-online gap control.
5) Negative sampling bias: hidden retrieval regression source
In deep retrieval systems, quality heavily depends on negative sampling design. If negatives are too easy, frequency-skewed, or detached from live exposure, offline loss can improve while online quality worsens.
Current references:
- Negative Sampling in Recommendation: A Survey and Future Directions (submitted 2024-09-11, revised 2025-07-25);
- Correcting the LogQ Correction: Revisiting Sampled Softmax for Large-Scale Retrieval (2025);
- On the Effectiveness of Sampled Softmax Loss for Item Recommendation, TOIS 2024;
- Open-access preprint version for sampled-softmax analysis: SSM: A Revisitation of Scaled Softmax for Recommender Systems.
- RecSys 2025 sampling/exposure context: accepted contributions.
Release checks:
- Negative frequency distribution across head/mid/tail.
- Hard-negative share by slice.
- Slice-level recall@K stability.
- Live coverage and novelty.
- Consistency between offline sampling policy and online funnel behavior.
6) Objective mismatch and stage coupling
Production recommendation is multi-stage: retrieval, early ranking, late ranking, reranking. Local gains in one stage do not guarantee end-to-end KPI gains.
Engineering references:
- Instagram recommendation system scaling (Meta, 2025);
- Instagram Explore architecture (Meta, 2023);
- YouTube DNN for recommendations (RecSys 2016).
Core point: if you optimize only for CTR, systems can drift into low-value behavior. You need a multi-objective setup with hard guardrails.
A practical multi-stage example is covered in Training a Hybrid LLM and Recommender System with Semantic IDs.
Example value function:
Important: without hard constraints, this is not a production control loop.
7) Minimal logging contract for real diagnostics
Without a solid log contract, offline-online gaps are not diagnosable in production.
| Field | Purpose |
|---|---|
request_id | end-to-end tracing |
session_id, user_id | cohort analysis and behavior sequencing |
event_ts | event-time semantics |
policy_id, model_version | release reproducibility |
rank_position, surface | presentation bias accounting |
candidate_source, stage | stage coupling diagnostics |
propensity | OPE and debiasing |
feature_snapshot_id | train/serve parity |
item_id, score_vector | model decision analysis |
reward, delayed_reward_ts | immediate vs delayed outcomes |
latency_ms, timeout, error_code | reliability and SLO |
cost_tokens, infra_cost | economics per useful outcome |
Example record:
request_id: 32b9c11d
session_id: s_8841
user_id: u_20144
event_ts: 2026-02-26T13:20:11Z
policy_id: feed_rank_v188
model_version: ranker_2026_02_26_7
surface: home_feed
stage: ranker_late
rank_position: 6
candidate_source: two_tower_retrieval
item_id: i_991244
propensity: 0.0241
feature_snapshot_id: fs_online_2026_02_26_1320
scores:
  p_click: 0.162
  p_long_watch: 0.071
  p_return_7d: 0.053
labels:
  click: 1
  long_watch_30s: null
  return_7d: null
runtime:
  latency_ms: 94
  timeout: false
economics:
  infra_cost_usd: 0.00041
8) Release protocol: 11 gates before 100% traffic
This extended protocol aligns with large-scale production release safety patterns: Uber deployment safety, Meta production engineering 2025.
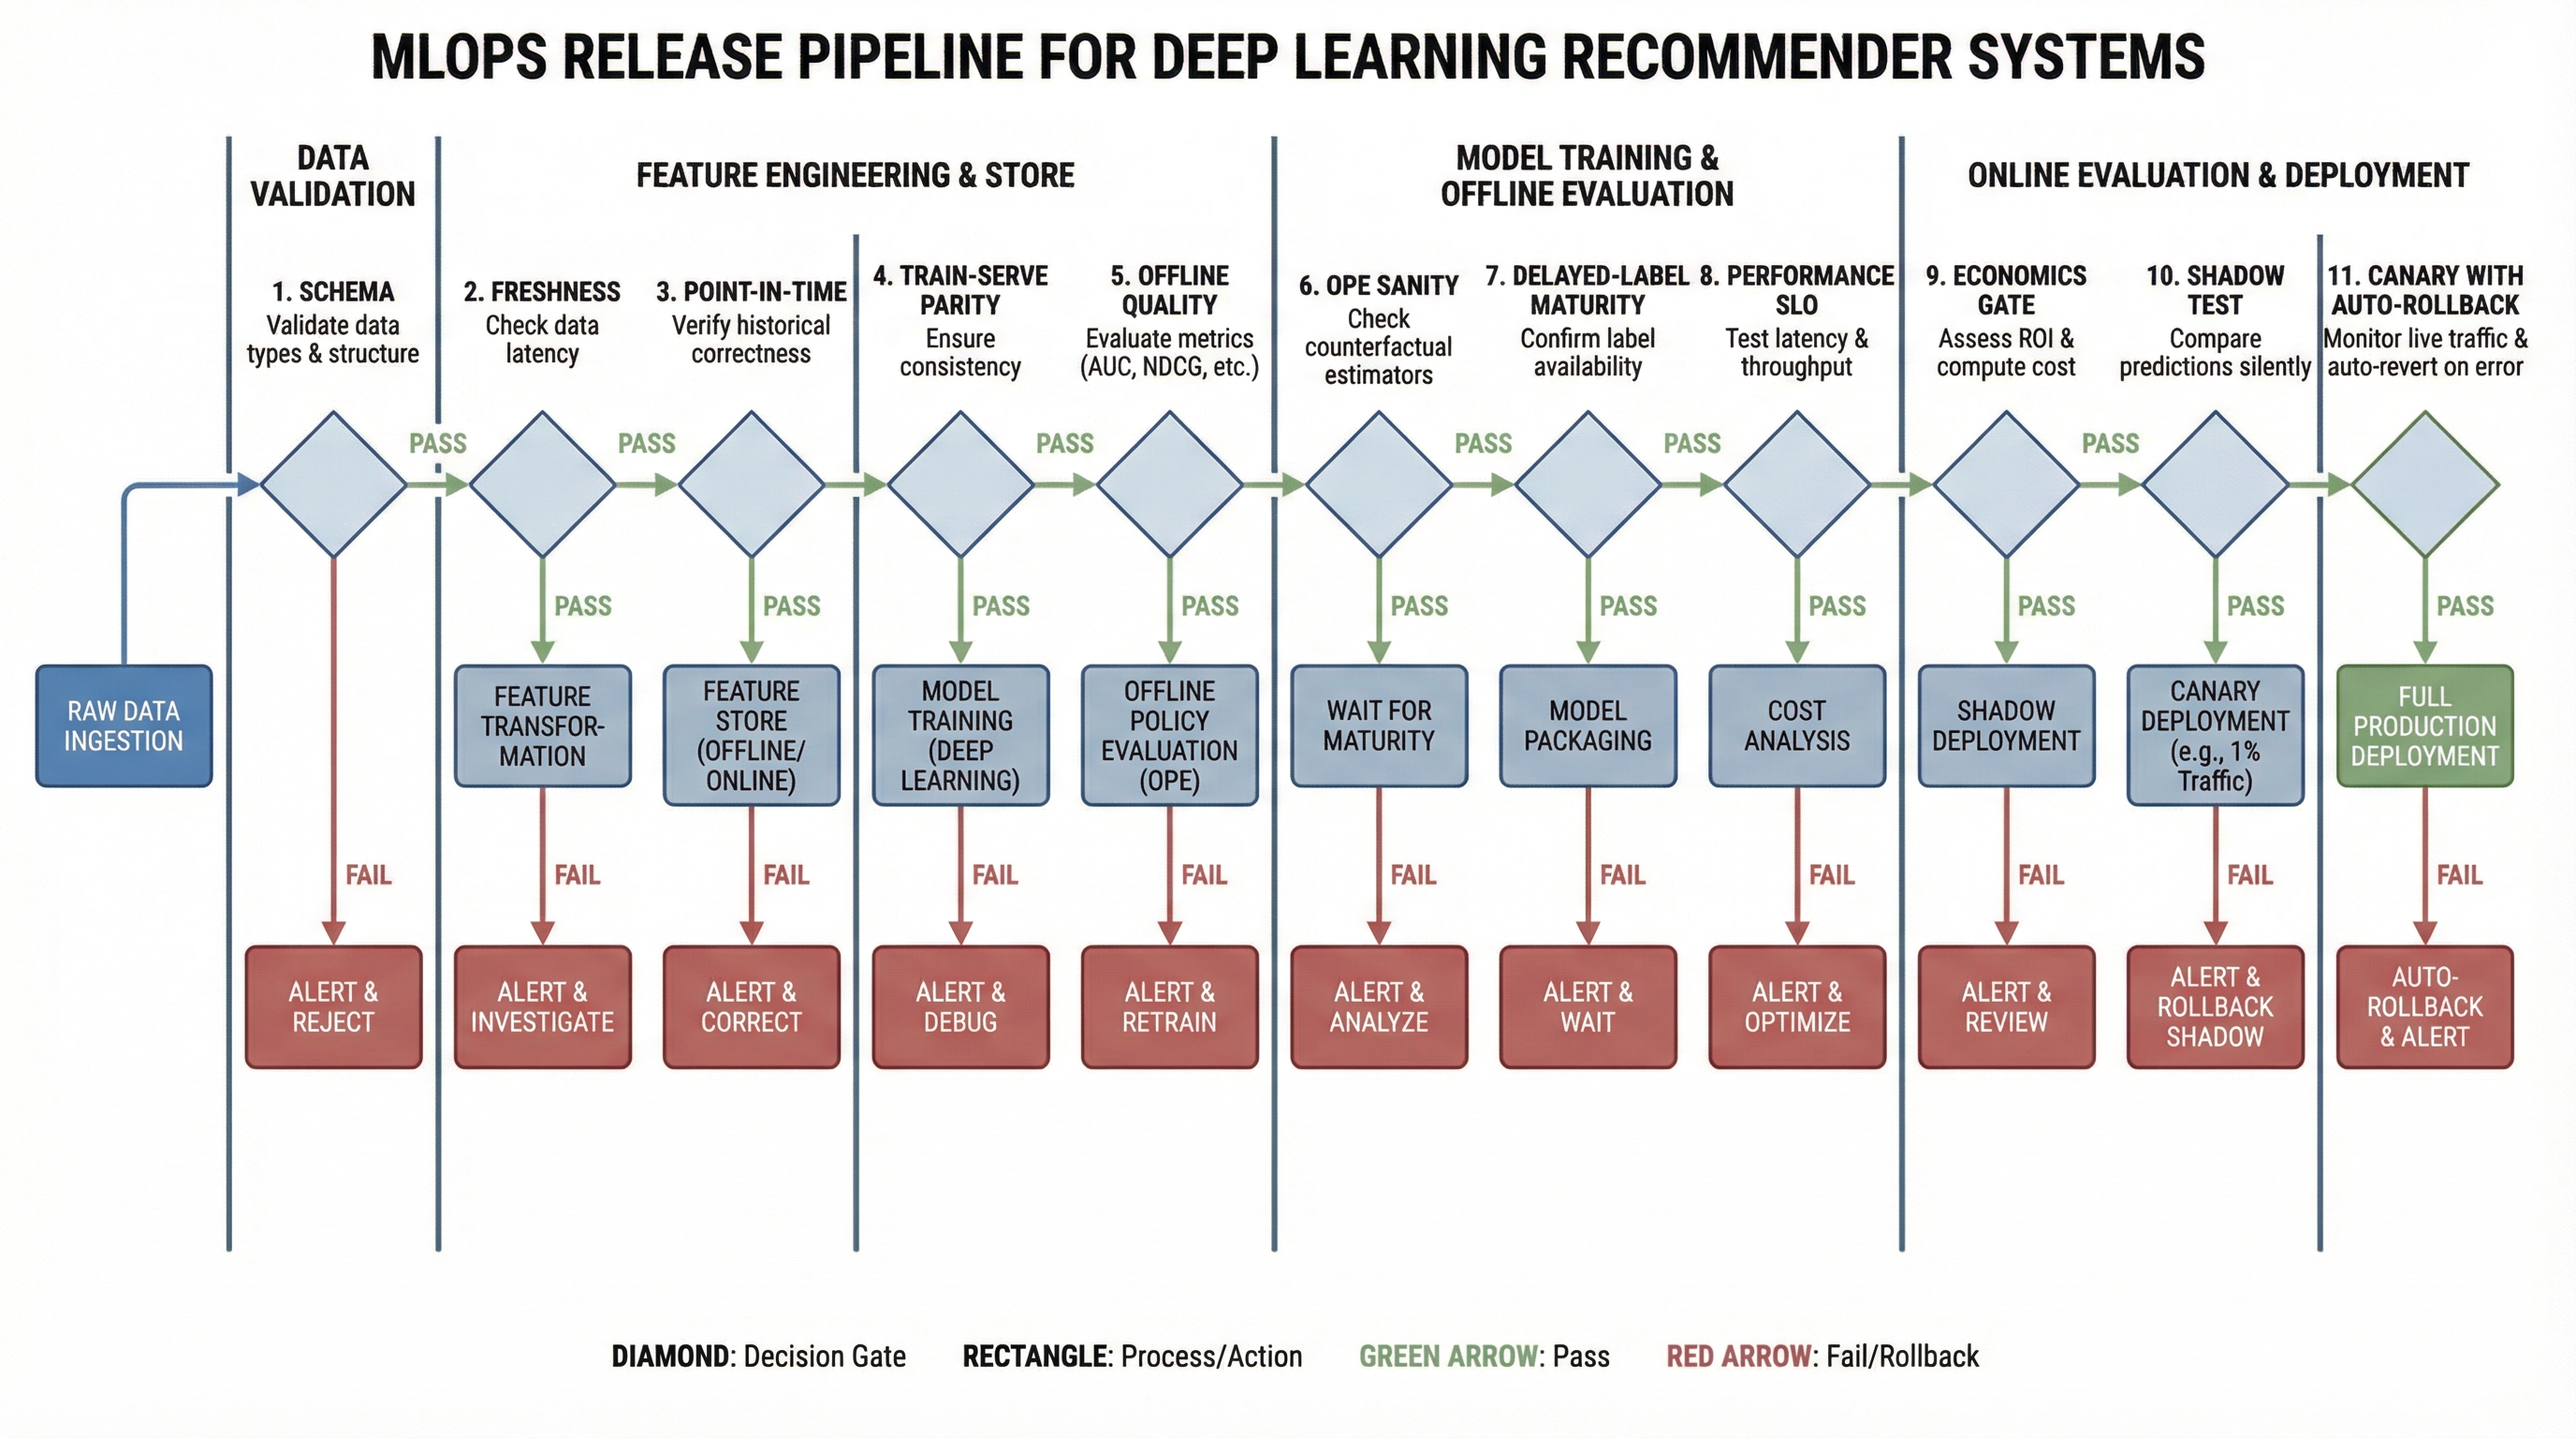
Extended release pipeline: each gate blocks rollout when it detects quality, SLO, or cost risk.
- Schema gate: input schema and types are valid.
- Freshness gate: data meets freshness SLA.
- PIT gate: point-in-time joins are leakage-free.
- Parity gate: train/serve feature parity stays in tolerance.
- Offline quality gate: core and slice metrics are in range.
- OPE sanity gate: OPE direction and variance are acceptable.
- Delayed-label gate: key labels are mature enough for decision.
- Performance gate: p95/p99 latency and timeout rate are inside SLO.
- Economics gate: cost per useful outcome stays within threshold.
- Shadow gate: shadow deltas stay in tolerance.
- Canary/rollback gate: auto-rollback is tested and stop rules are explicit.
9) Metrics set required for release decisions
9.1 Data
- null-rate and schema violations;
- freshness lag;
- drift/skew on critical features;
- share of events with complete log contract.
9.2 Model
- score distribution;
- calibration error;
- entropy by slice;
- recall@K / nDCG@K on control cohorts.
9.3 Product
- CTR as a supporting metric;
- downstream KPIs: long watch, retention proxy, complaint rate;
- coverage, novelty, diversity by cohort.
9.4 Economics
- infra cost;
- cost per useful outcome;
- retraining and online inference resource share;
- forecast vs realized economics after rollout.
9.5 Fast diagnostic map: symptom -> likely cause -> first action
| Post-release symptom | Most likely cause | First action |
|---|---|---|
| CTR up, retention down | Objective mismatch | Validate long-term guardrails, freeze rollout expansion |
| Offline nDCG up, online recall down | Negative sampling bias | Re-audit retrieval with sampling policy and slice checks |
| Immediate degradation after deployment | Train/serve skew | Run parity check on live snapshot and compare feature path |
| Early metrics good, drop at day 3-7 | Delayed labels | Re-evaluate on mature window and pause expansion |
| Head concentration rises, diversity falls | Feedback loop + exposure bias | Tighten cohort/diversity guardrails, reduce policy aggressiveness |
9.6 Reference thresholds for release gates (starter values)
These are starting values, not universal defaults. Calibrate to your baseline and seasonality.
| Domain | Metric | Green | Yellow | Red |
|---|---|---|---|---|
| Reliability | p95 latency | <= +5% vs baseline | +5% .. +10% | > +10% |
| Reliability | timeout rate | <= 0.5% | 0.5% .. 0.8% | > 0.8% |
| Quality | long-term KPI (retention proxy) | >= 0 delta | 0 .. -1.5% | < -1.5% |
| Quality | coverage@K | >= -1% | -1% .. -3% | < -3% |
| Quality | diversity/novelty | in guardrail range | slight degradation | significant degradation |
| Data | train/serve parity | in tolerance | partial drift | systemic skew |
| Economics | cost_per_useful_outcome | <= +3% | +3% .. +8% | > +8% |
Escalation rule:
- Any red blocks canary expansion.
- Yellow is allowed only with explicit mitigation and limited traffic.
- 100% rollout requires zero red and controlled yellow.
10) Experiment protocol: how to align offline and online
Minimal cycle:
- Build a shortlist from offline + slice + stability checks.
- For each candidate, define a hypothesis for downstream KPI impact.
- Run shadow using the same log contract as production.
- Run canary
5% -> 25% -> 50% -> 100%with auto-stop. - Evaluate immediate and delayed KPIs separately.
- Record which offline indicators actually predict online outcomes.
If the system has orchestration complexity, validate architecture decisions using Agent or Workflow: How to Choose Architecture Without Hype.
Baseline stop conditions:
canary_stop_conditions:
  - p95_latency_ms > 180 for 10m
  - timeout_rate > 0.8% for 5m
  - retention_proxy_delta < -1.5% after maturation_window
  - cost_per_useful_outcome_delta > +8%
10.1 How to test whether an offline metric predicts online
Common mistake: treating any offline gain as proof of future online gain. You need explicit predictive validation.
Minimal protocol:
- Collect
N >= 8releases under a consistent measurement contract. - For each release, record
delta_offlineanddelta_onlineon mature windows. - Compute rank correlation (Spearman), not only linear correlation.
- Check lagged relationships at
0/7/14days for delayed KPIs. - Keep only metrics with stable directional relationship in release reports.
If direction is unstable, the metric should not be a release gate; it can only be a supporting signal.
11) Incident playbook: when offline is up but online is down
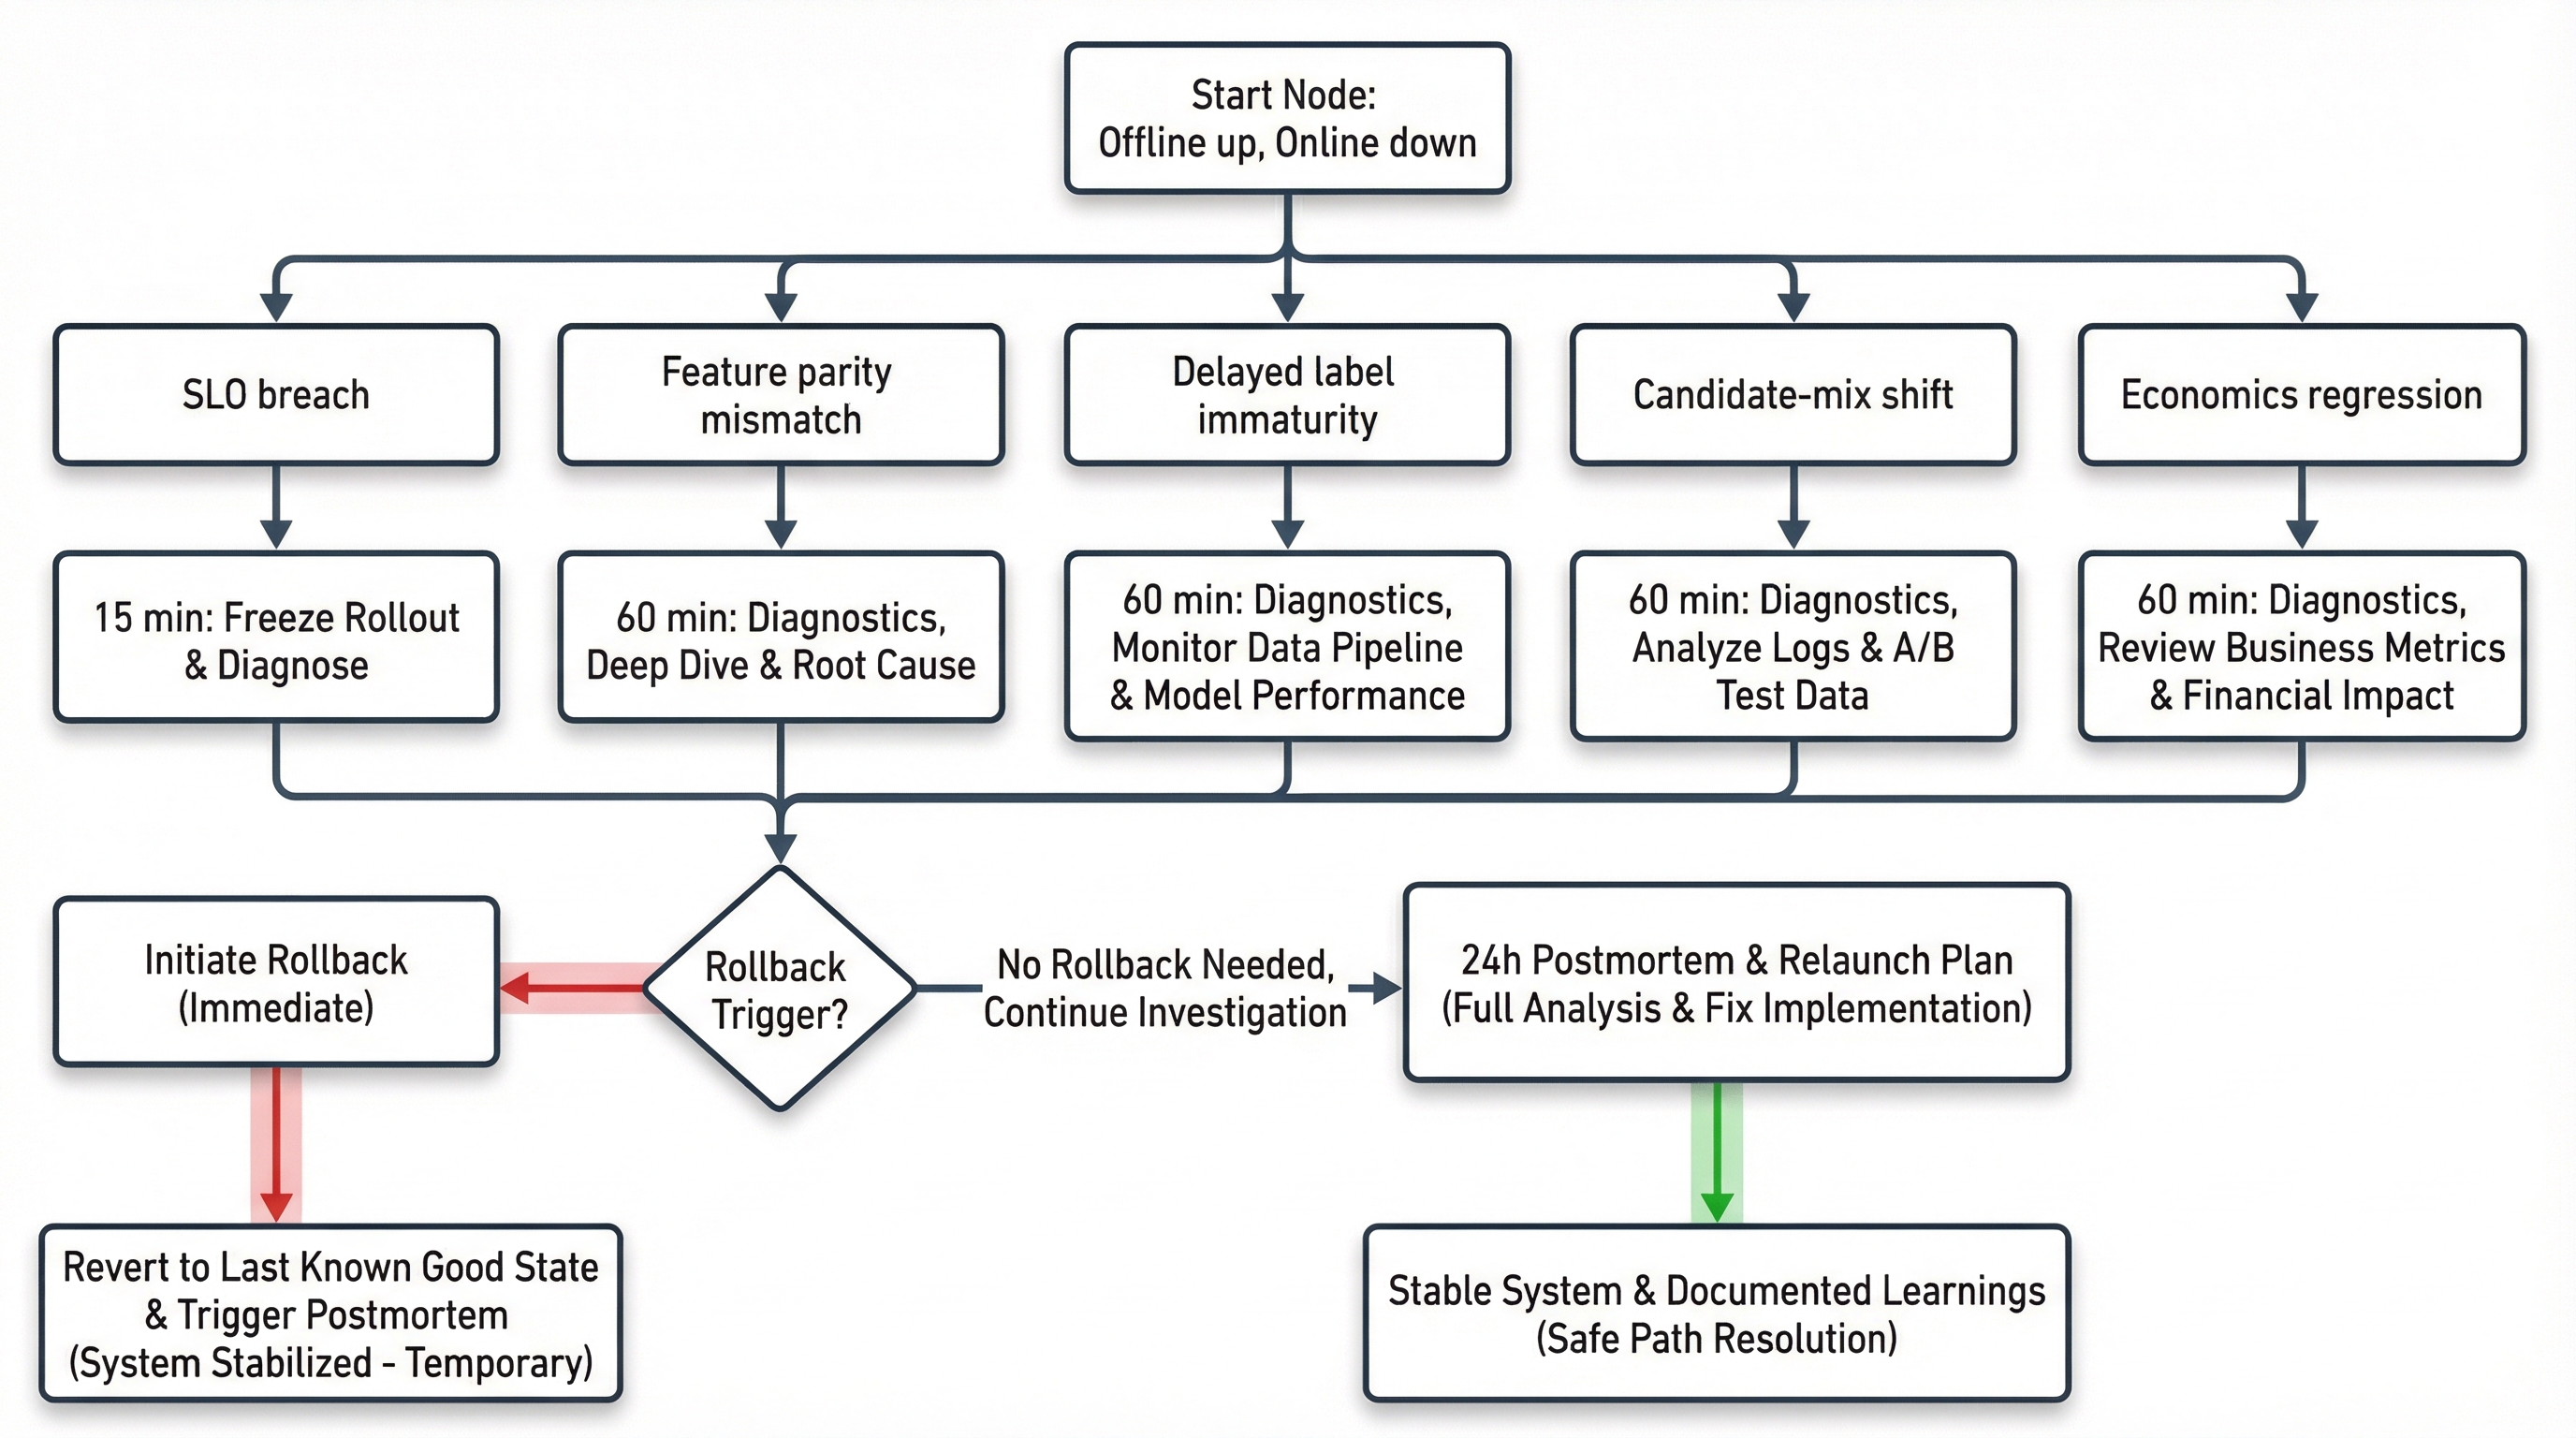
Incident decision tree: what to check in the first 15 minutes, 60 minutes, and 24 hours to isolate root cause and recover safely.
First 15 minutes
- Freeze current rollout.
- Capture
policy_id,model_version, and degradation start time. - Check system health first: latency, errors, timeouts.
- Switch monitoring to direct comparison against the previous stable policy.
First 60 minutes
- Verify train/serve parity on a live snapshot.
- Check candidate composition by stage.
- Check delayed-label maturity.
- Compare key cohorts.
- Decide rollback vs constrained hotfix.
First 24 hours
- Produce a postmortem with root cause.
- Update release gates if a missing check is found.
- Update sampling/objective/policy contract.
- Prepare a controlled re-rollout.
For mixed recommender + RAG/tool-call systems, related guardrails are covered in MLOps for a Support RAG Agent in 2026: Releases, Security, and Cost.
12) Economics: why a cost gate is mandatory
A common mistake is tracking only cost/request. For recommender systems, that is too coarse. Use:
Track at least two windows:
7d: operational control right after release;30d: stable economic viability decision.
If quality improves slightly but cost_per_useful_outcome crosses threshold, the release is not successful.
13) Checklists
13.1 Pre-release checklist
- Log contract includes
propensity,position,feature_snapshot_id,stage. - PIT-correct training dataset is verified.
- Train/serve parity is in tolerance.
- Delayed KPI has a mature decision window.
- OPE is used as candidate filtering, not as online-test replacement.
- Shadow and canary are ready with explicit stop conditions.
- Auto-rollback is tested.
- Economics gate includes
cost_per_useful_outcome.
13.2 Post-release checklist (72h)
- Drift/skew under control on critical features.
- Calibration and score distribution are stable.
- Guardrail KPIs are stable by cohort.
- Stage funnel shows no hidden regressions.
- Economics gate passes on 7d horizon.
13.3 Release decision memo template (1 page)
release_id: recsys_ranker_2026_02_26_r3
owner: ml-platform + ranking-team
scope: home_feed ranking policy
traffic_step: 25% -> 50%
gates:
  reliability: green
  quality: yellow
  economics: green
known_risks:
  - delayed labels are not mature on the full window yet
mitigations:
  - freeze rollout until mature-window checkpoint
  - increase cohort monitoring for new users
decision: hold
next_review_at: 2026-03-02T10:00:00Z
rollback_plan: rollback_to=feed_rank_v187 rto=10m
14) 30-60-90 implementation plan
Days 0-30
- Add minimum log contract and parity checks.
- Move rollout to shadow + canary + rollback.
- Formalize stop conditions.
Days 31-60
- Add PIT validation and delayed-label maturity metrics.
- Add stage-level attribution dashboards.
- Add economics gate with
cost_per_useful_outcome. - Align feature/data storefront structure with Search and Recommendation System to avoid offline/online source-of-truth drift.
Days 61-90
- Add replay/simulation loop for feedback-loop risk.
- Lock a documented map from offline metrics to online predictors.
- Make postmortem protocol part of the release process.
15) What counts as sustained improvement
A release is sustainably successful only if all conditions hold:
- Offline: gain on core + slice metrics without abnormal variance.
- Shadow/Canary: no SLO, guardrail, or economics violations.
- Mature window: delayed KPIs confirm the same direction.
- Stage consistency: local gains do not break end-to-end funnel.
- Rollback readiness: tested rollback in target RTO.
If any condition fails, treat it as a partial experiment, not stable improvement.
16) Common anti-patterns
- Offline-only decision without mature-window verification.
- No
propensityin logs while making OPE claims. - Different transformation logic in train vs serve.
- CTR treated as final objective without downstream constraints.
- Canary exists formally, but has no tested auto-stop/auto-rollback.
- Tracking
cost/requestbut notcost_per_useful_outcome.
17) FAQ: offline-online gap in RecSys
Why do offline metrics improve while online KPIs drop
Because offline is computed on historical policy logs, while rollout changes exposure and observed distributions. Without feedback-loop, delayed-label, and train/serve controls, offline gains often fail online.
Can we make release decisions from OPE/IPS only
No. OPE is useful for ranking candidates, but not as the only gate. You still need shadow/canary, mature delayed-KPI validation, and a tested rollback path.
What is a minimum safe canary for deep learning RecSys
5% -> 25% -> 50% -> 100% is a practical starter pattern if auto-stop, SLO guardrails, economics gate, and tested rollback are in place. High-risk surfaces may need smaller steps.
Which is more important: model quality or economics
In production, they are one system constraint. A release succeeds only if quality, SLO, and cost_per_useful_outcome all stay in acceptable range.
18) Related materials
- Practical release gate baseline: MLOps for Production ML: 7 Release Gates for Controlled Rollouts.
- Multi-stage retrieval/ranking example with DL: Training a Hybrid LLM and Recommender System with Semantic IDs.
- Architecture control trade-offs: Agent or Workflow: How to Choose Architecture Without Hype.
- Quality-cost linkage in production: ML Inference Latency and Cost Evaluation Platform.
- End-to-end search/recommendation system context: Search and Recommendation System.
19) One-page decision card before 100% rollout
Before final traffic expansion, answer these 6 questions:
- Is there a mature delayed-KPI window, and does it agree with early signal?
- Did train/serve parity pass on a live snapshot?
- Is cohort/slice behavior stable, not only the global average?
- Are SLOs (
p95/p99, timeout, error rate) in range at the current canary step? - Is
cost_per_useful_outcomestill inside threshold? - Is rollback verified for this version with explicit RTO?
If any answer is “no”, stop expansion and resolve before proceeding.
Conclusion
Offline-online regressions in deep learning RecSys are not random anomalies. They are expected behavior in systems without strong production controls. The stronger the model, the more expensive control failures become.
In practice, stable outcomes come from engineering discipline across the full chain:
- strict log contract;
- counterfactual evaluation with explicit limits;
- point-in-time correctness and train/serve parity;
- release gates with shadow/canary/rollback;
- unified monitoring of quality, reliability, and economics.
That is how you reduce the gap between a good report and a bad real-world rollout.
FAQ
Why can offline RecSys metrics improve while online KPIs fall?
Because rollout changes exposure and user behavior. Historical logs no longer represent the live policy, so offline gains can overestimate real-world impact.
Which checks reduce offline-online regressions fastest?
Use strict data contracts, point-in-time feature validation, staged rollout gates, and monitoring for drift, calibration, latency, and cost.
What should be in a RecSys incident playbook?
A rollback trigger, affected slice diagnostics, feature parity checks, retrieval and ranking health checks, and explicit owner responsibilities for recovery.